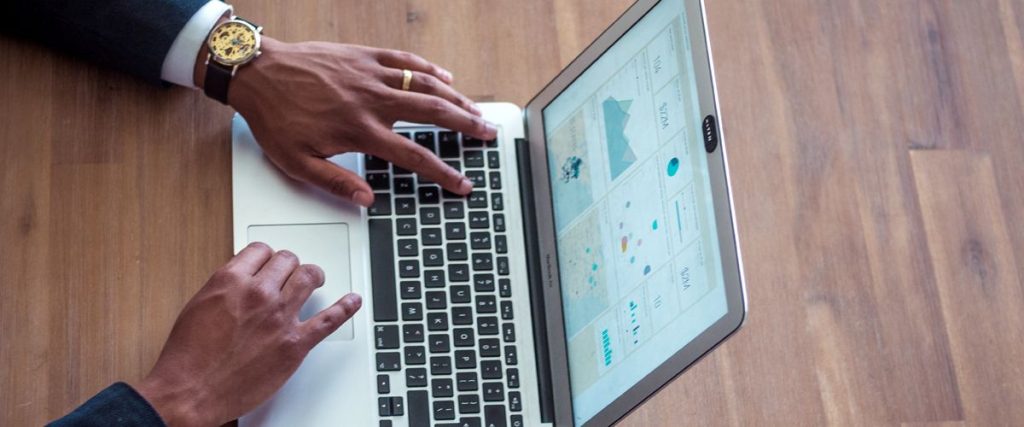
One of the aspects of our platform that brings the biggest smiles to our faces, is that we can get real data from our events. We know that this makes the lives of the event managers we work with easier and allows them to show the ROI quicker to their clients, and their clients sponsors.
Part of the analytics we track is right from sending out emails, seeing the opens, accepts, declines (all automatically tallied), through to the event app downloads, page views, section views, survey responses, and interactive session data, tallied and stored for use by the event organisers and end client. We can divide this up between Android users and iOS users to tell us a bit more about the demographic of the target market, and even down to the actual device being used by guests (generally, Huawei, LG, Samsung or Apple).
Some of the most popular analytics are speaker views, including which speakers got the best guest ratings, as well as the session views and which sessions were most loved and most popular with delegates. The more you can analyse the data and deduce conclusions, the more valuable this data becomes, and you realise the importance of these analytics at all events, so you know how to improve them.
For sponsorship values and to show them their involvement ROI, exhibitor views on their app pages would be key, as well as the sponsorship banner views, i.e. the amount of times guests saw the sponsors banner display on the home page (these numbers can often be up to 100 000 views!).
Another special feature of our event platform is that you can gather and keep all data from the interactive sessions like the word clouds, questions sent in, and the poll votes. These are key metrics to hold on to, and they really come in handy especially to keep the momentum going after the event. Throughout the event, guests are invited to send in questions and comments, as well as their opinion on polls, and that information becomes vital for gathering insights. It’s almost impossible to run an event after that without analytics because you know just how much information you will be missing out on.
There are tons of ways to use the data gathered from your events. It is even used to incentivise guests to participate more as they can see who has posted the most on social networks, or sent in the most questions during sessions. This way interactivity and engagement can be ramped up, all from the app.
If you would like access to this data for your next event or would like to find out more about our event-tech solutions, get in touch with us, book a demo or go straight to Get a Quote.
